M 034 / 18302 Masks & Controlalgorithm output

Graph Segmentation

segmentation, masks & control
Typeface · Barlow

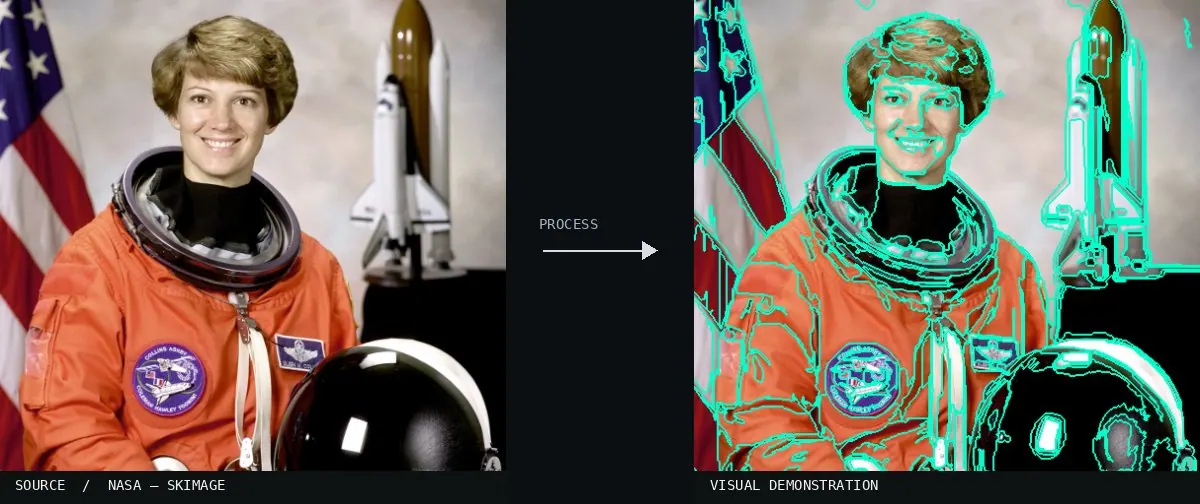
Real-world algorithm demonstration, applied to a NASA portrait.
Real-world algorithm demonstration, applied to a NASA portrait.Image: NASA / Eileen Collins · scikit-image (public domain)View source ↗

Prompt

Apply Graph Segmentation to group neighboring areas of similar appearance into irregular, connected regions of widely varying sizes. Use flattened local colors and fine contrasting boundary lines, retaining small distinctive patches while merging broad uniform surfaces. Avoid a regular grid or evenly sized cells. Keep the original subject and composition.

Identify

Irregular regions follow local color differences.

Principle

A graph algorithm1 groups together visually similar neighboring pixels.

Try it out

Compare with SLIC2.

Classification

Calculated image processing result.

Further examples · 8 images

Fig-14-Result-comparisons
02 Fig-14-Result-comparisonsA llama head is isolated from a mountain background using different seed methods. The results show how graph-based cuts successfully partition the animal as a foreground object based on color and edge similarity.Junxia Li, Jundi Ding, Jian Yang, Lingzheng Dai · CC BY 4.0 · Wikimedia Commons
Maxflow imagesegmentation result
03 Maxflow imagesegmentation resultThis diagram displays a mathematical graph where nodes are partitioned into two distinct sets. It demonstrates the max-flow min-cut principle, which is the computational foundation for separating image regions in graph segmentation.Fschwarzentruber · CC BY-SA 4.0 · Wikimedia Commons
Spectral clusterization example
04 Spectral clusterization exampleA mathematical graph diagram shows nodes connected by edges, with dashed lines representing a cut. This illustrates the fundamental graph-cut theory used to partition data into distinct segments.BogdanShevchenko · CC BY-SA 4.0 · Wikimedia Commons
Graph Segmentation, applied to “Sparkler”
05 Graph Segmentation, applied to “Sparkler”A sparkler's light is divided into jagged, irregular polygons following luminance paths. The algorithm groups pixels by color similarity, creating elongated segments along the bright streaks.Gabriel Pollard (photo); processed for the Atlas · CC BY-SA 2.5 · Wikimedia Commons
Graph Segmentation, applied to “Duna Mayor, Valle de la Luna, San Pedro de Atacama, Chile, 2016-02-01, DD 173-17”
06 Graph Segmentation, applied to “Duna Mayor, Valle de la Luna, San Pedro de Atacama, Chile, 2016-02-01, DD 173-17”The Chilean desert landscape is reduced to flat, irregular regions of color. Subtle sky and sand gradients are partitioned into organic shapes that vary in size based on local detail.Diego Delso (photo); processed for the Atlas · CC BY-SA 4.0 · Wikimedia Commons
Graph Segmentation, applied to “2017.06.17.-16-Reinheimer Teich-Reinheim--Sumpf-Storchschnabel”
07 Graph Segmentation, applied to “2017.06.17.-16-Reinheimer Teich-Reinheim--Sumpf-Storchschnabel”A purple marsh crane's-bill flower is isolated against a simplified green background. Irregular boundaries follow the internal veins and petal shadows, capturing the complex structure through graph-based grouping.Andreas Eichler (photo); processed for the Atlas · CC BY-SA 4.0 · Wikimedia Commons
Graph Segmentation, applied to “Disa uniflora (Peter Jonas Bergius 1767)”
08 Graph Segmentation, applied to “Disa uniflora (Peter Jonas Bergius 1767)”This orchid is rendered as a collection of distinct color segments against a black field. The segments vary in scale, with smaller regions appearing where light shifts rapidly on the petals.Michael Gäbler (photo); processed for the Atlas · CC BY-SA 3.0 · Wikimedia Commons