M 035 / 18302 Masks & Controlalgorithm output

Watershed Regions

segmentation, masks & control
Typeface · Merriweather

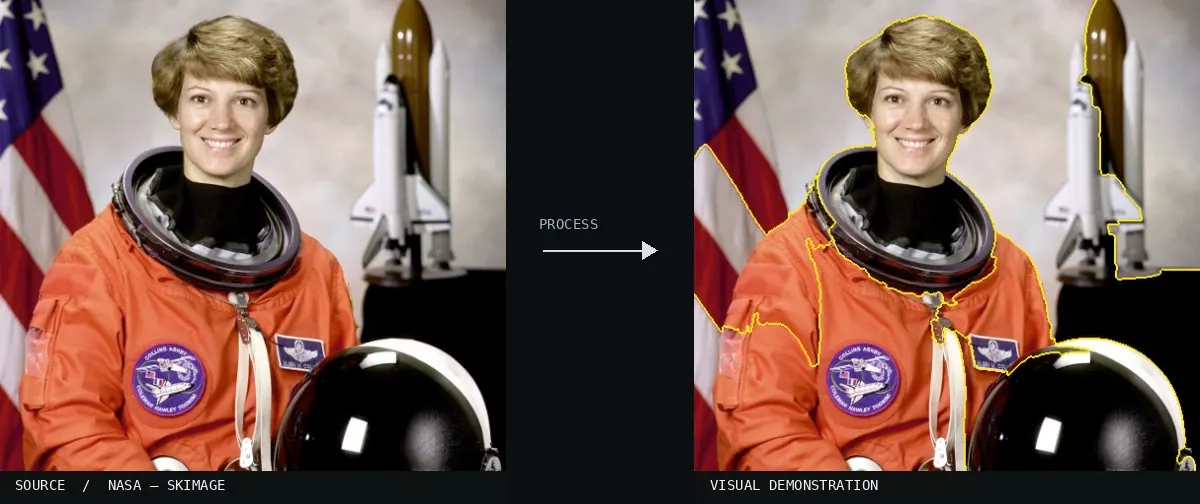
Real-world algorithm demonstration, applied to a NASA portrait.
Real-world algorithm demonstration, applied to a NASA portrait.Image: NASA / Eileen Collins · scikit-image (public domain)View source ↗

Prompt

Transform this image into a Watershed Regions visualization with interlocking catchment-like patches separated by thin, sharply defined boundary lines. Let regions follow brightness-gradient ridges, using varied translucent colors over subdued photographic detail. Include smaller basins in textured areas and broader basins across smooth surfaces. Keep the original subject and composition.

Identify

Boundaries act like catchment areas on a topographic map.

Principle

Brightness gradients are interpreted as a landscape with watersheds1.

Try it out

Test the number of markers2 and smoothing.

Classification

Calculated image processing result.

Further examples · 7 images

Xenodens calminechari (MHNM.KHG.1117, CT segmentation)
02 Xenodens calminechari (MHNM.KHG.1117, CT segmentation)3D CT scan segmentation of fossil teeth using distinct color labels. Individual teeth are separated from the jaw bone, likely using a watershed-based approach to define boundaries in the volumetric density data.N. R. Longrich, N. Bardet, N.-E. Jalil, X. Pereda-Suberbiola, A. Schulp, M. Ghamizi · CC BY 4.0 · Wikimedia Commons
HiP-CT with 3D image analysis and morphometry in the lung of a patient with COVID-19
03 HiP-CT with 3D image analysis and morphometry in the lung of a patient with COVID-19Three-dimensional segmentation of lung air spaces from HiP-CT imaging. The process uses intensity gradients to define the individual catchment areas of alveoli, creating a complex segmented landscape for morphometric analysis.Authors of the study: C. L. Walsh, P. Tafforeau, W. L. Wagner, D. J. Jafree, A. Bellier, C. Werlein, M. P. Kühnel, E. Bo · CC BY 4.0 · Wikimedia Commons
Watershed Regions, applied to “360° Hochalppass Panorama”
04 Watershed Regions, applied to “360° Hochalppass Panorama”A mountain panorama is divided into segmented color blocks. The algorithm uses brightness gradients to define catchment boundaries between the sky, snow, and rocks.böhringer friedrich (photo); processed for the Atlas · CC BY-SA 2.5 · Wikimedia Commons
Watershed Regions, applied to “VitorJubini PaneleirasdeGoiabeiras Vitoria ES (40735316325)”
05 Watershed Regions, applied to “VitorJubini PaneleirasdeGoiabeiras Vitoria ES (40735316325)”Steam rising from a dark pot is partitioned into distinct shapes. These irregular polygons represent local intensity minima and maxima within the complex smoke patterns.MTur Destinos (photo); processed for the Atlas · Public domain · Wikimedia Commons
Watershed Regions, applied to “Waterloopbos, 24-06-2024. (actm.) 09”
06 Watershed Regions, applied to “Waterloopbos, 24-06-2024. (actm.) 09”Concrete walls and columns in the Waterloopbos are translated into a topographic grid. Sharp edges and texture variations determine the perimeter of each watershed region.Agnes Monkelbaan (photo); processed for the Atlas · CC BY-SA 4.0 · Wikimedia Commons
Watershed Regions, applied to “Cypripedium calceolus - Kaunis kuldking Keila”
07 Watershed Regions, applied to “Cypripedium calceolus - Kaunis kuldking Keila”A slipper orchid and its grassy background are converted into segmented cells. The dark ridge lines mark the boundaries where intensity gradients separate the botanical features.Ivar Leidus (photo); processed for the Atlas · CC BY-SA 3.0 · Wikimedia Commons