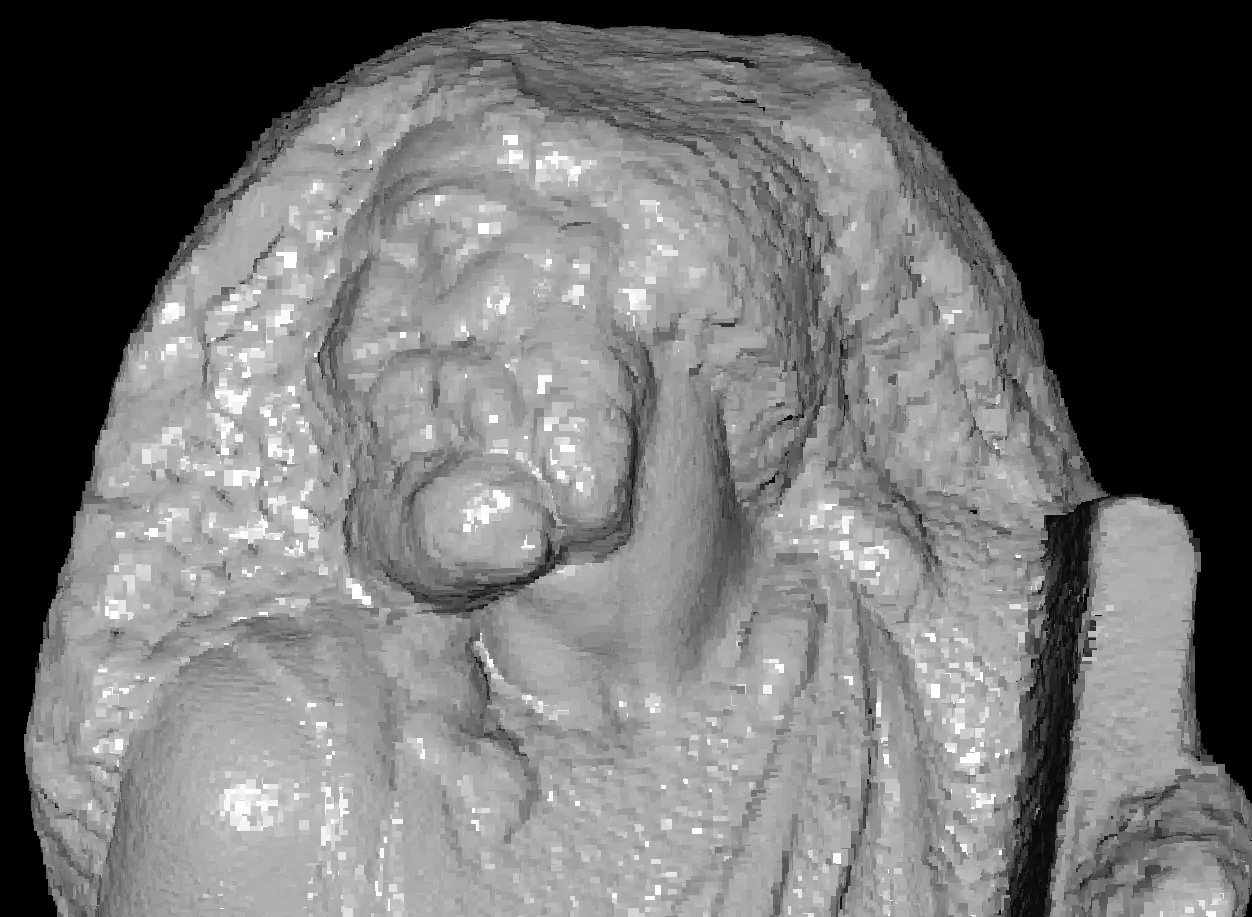
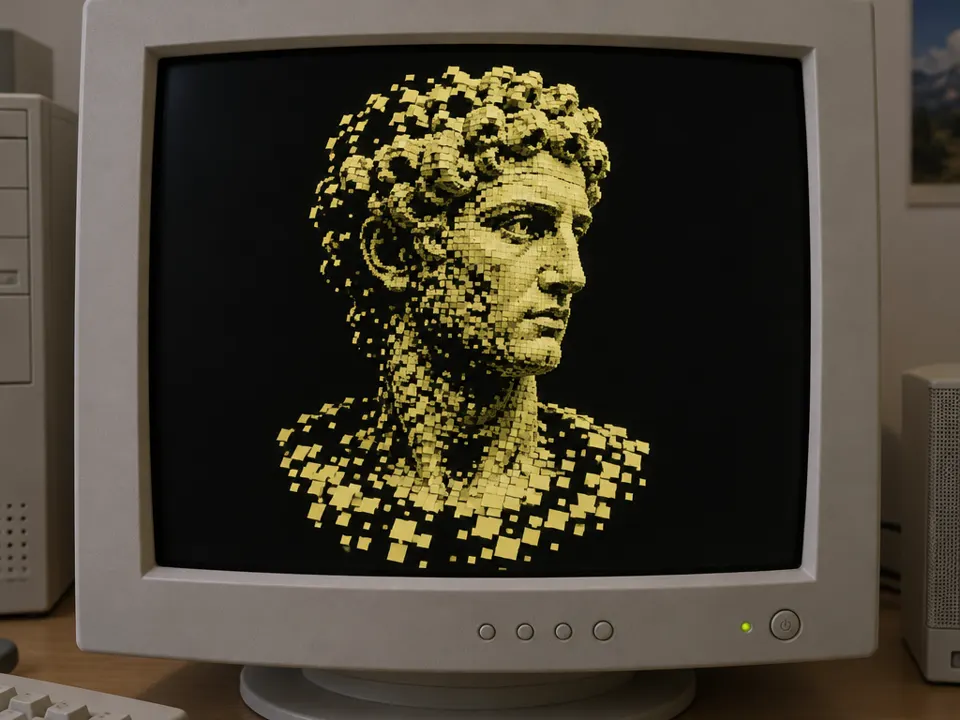
Point-cloud rendering / point-based rendering. 2000: QSplat as an important point rendering milestone
Typeface · DotGothic16
QSplat: rough rendering stage of a scanned model, 2000.Szymon Rusinkiewicz and Marc Levoy / Stanford Computer Graphics Laboratory.View source ↗
Prompt
Transform this image into a Point Cloud Rendering, rebuilding visible surfaces from dense spatial dots and tiny colored splats. Introduce sparse gaps, depth-dependent point sizes, granular silhouettes, and a dark background visible between samples. Avoid continuous polygon surfaces while retaining recognizable volumes. Keep the original subject and composition.
Surfaces appear as [spatially distributed dots or small splats1].
Principle
[Sampled spatial points]are [drawn directly]instead of only being connected via polygon surfaces2.
Example
Rusinkiewicz and Levoy: QSplat, SIGGRAPH 2000.
Try it out
Reduce the dot density; observe the silhouette and gaps.
Background
Apoint cloud stores spatial samples, such as those from ascan. It can be displayed as avisible field of points or refined into anearly closed surface. QSplat by Rusinkiewicz and Levoy, presented at SIGGRAPH 2000, combined ahierarchical data structure with point-based rendering for very large scan models. The rendering becomes coarser during movement, while the image can progressively become finer when stationary. The illustration therefore deliberately shows acoarse level of refinement, not damage to the model. In this exercise, gradually reduce the point value. Investigate when the outer shape is still legible, while details disappear. This will reveal the relationship between sampling density, speed, and the aesthetic appearance of the points.
Distinction
Point cloud refers to data; Point-Based Rendering refers to the representation of this or similar data.
Aftermath
The visible scan point later becomes astylistic device itself. Geometric scanning and the finished photorealistic reconstruction are nevertheless different representations.
Further examples · 7 images
02LiDAR visualization of bulk material in an open-top truckScanning of a truck interior shows a visible distribution of spatial samples. The granular nature of the point cloud is evident in areas where the density decreases, revealing the underlying sampling process.Mweaver89 · CC BY-SA 4.0 · Wikimedia Commons033D Point Cloud Overview of Milton S. Eisenhower Library, Johns Hopkins UniversityA library building is shown as a complex 3D point cloud with varying levels of detail. The rendering displays distinct clusters of points and spatial gaps characteristic of large-scale architectural scans.Matthewadams66 · CC0 · Wikimedia Commons04St. Michael Cathedral sparse point cloud test - 5e0dcb8bc9dd43258eb5f1fa04c15c95A cathedral is rendered as a sparse point cloud against a plain background. This example clearly shows the spatial distribution of dots and how the silhouette remains legible despite a very low density.Calin Suteu · CC BY 4.0 · Wikimedia Commons05Metodo 1 - punti di legame tra foto, sparse point cloud, NELACA sparse point cloud represents a building using scattered dots. It demonstrates how surfaces are defined by individual spatial samples rather than connected polygon faces, illustrating the fundamental raw data structure.Unknown · CC BY-SA 4.0 · Wikimedia Commons06Long-range procedure (documentation dolmen of Guadalperal). Gross point cloud using TLS. General views of the dense point cloud with photogrThese archaeological site views are generated from terrestrial laser scanning and photogrammetry. The rendering consists of millions of spatial points, capturing complex terrain without traditional surface meshing.Cerrillo-Cuenca, E., de Sanjosé Blasco, J.J., Bueno-Ramírez, P. et al. Emergent heritage: the digital conservation of ar · CC BY-SA 4.0 · Wikimedia Commons07AI illustration: A classical bust is rendered using discrete yellow square splats on a darA classical bust is rendered using discrete yellow square splats on a dark background. The variable density and visible gaps between points illustrate a hierarchical, coarse level of point-based surface refinement.Illustration generated for the Atlas (AI)
Question
Is a roughly pixelated view necessarily an inaccurate scan?
Show possible answer +Hide answer −
No. It could be areduced representation level of avery dense and precise dataset.