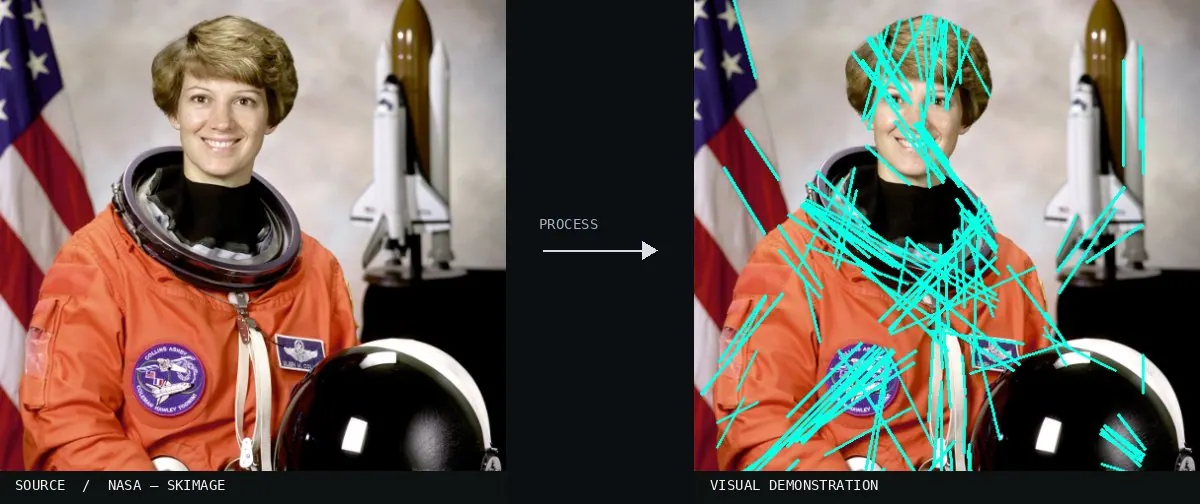
Real-world algorithm demonstration, applied to a NASA portrait.Image: NASA / Eileen Collins · scikit-image (public domain)View source ↗
Prompt
Apply a Hough Line Transform visualization over a slightly dimmed version of the photograph. Overlay thin, saturated red, cyan, and yellow straight segments aligned precisely with existing linear boundaries. Highlight dominant architectural or geometric directions without tracing curves or adding arbitrary lines. Keep the original subject and composition.
02HoughSpace2DA diagram showing points in image space mapped to sinusoidal curves in Hough parameter space. The intersection points indicate the parameters of the straight line passing through the original points.No machine-readable author provided. NekoJaNekoJa~commonswiki assumed (based on copyright claims). · CC BY-SA 3.0 · Wikimedia Commons03Hough transform diagramThe graphic demonstrates the relationship between lines in an image and their polar coordinate representation. It illustrates how the distance and angle parameters define lines during the transform process.Derfopps · CC BY 4.0 · Wikimedia Commons04Hough-example-result-enThe image displays two intersecting lines and their corresponding accumulator space representation. The bright spots in the right panel highlight where votes concentrate to identify the linear features.Daf-de · CC BY 2.5 · Wikimedia Commons05Hough sampleThis educational diagram plots discrete points on a line and shows their individual sinusoids in Hough space. It demonstrates how collinear points generate curves that intersect at a single coordinate.Original uploader was Nico73 at fr.wikipedia · LGPL · Wikimedia Commons06Ej1 matlabA source photo of a gantry crane is displayed above its corresponding Hough transform. The parameter space plot shows peaks representing the dominant lines detected in the structural geometry of the crane.Laura.cotrina · CC BY-SA 3.0 · Wikimedia Commons07AI illustration: A building is overlaid with a grid of purple and green linesA building is overlaid with a grid of purple and green lines. These segments trace the architectural edges, demonstrating how the transform detects and highlights linear structures within a digital image.Illustration generated for the Atlas (AI)