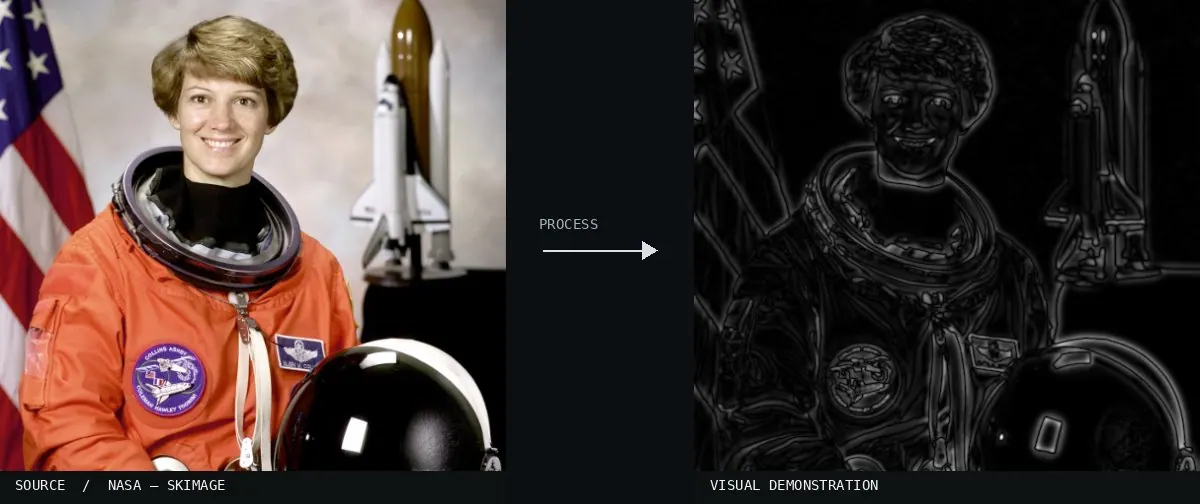
Real-world algorithm demonstration, applied to a NASA portrait.Image: NASA / Eileen Collins · scikit-image (public domain)View source ↗
Prompt
Apply Difference of Gaussians, creating a monochrome bandpass rendering with pale and dark contour halos around medium-scale details. Flatten broad lighting gradients and suppress the finest grain, leaving selected textures and high-contrast transitions prominent against midgray. Use soft, closely spaced edge bands. Keep the original subject and composition.
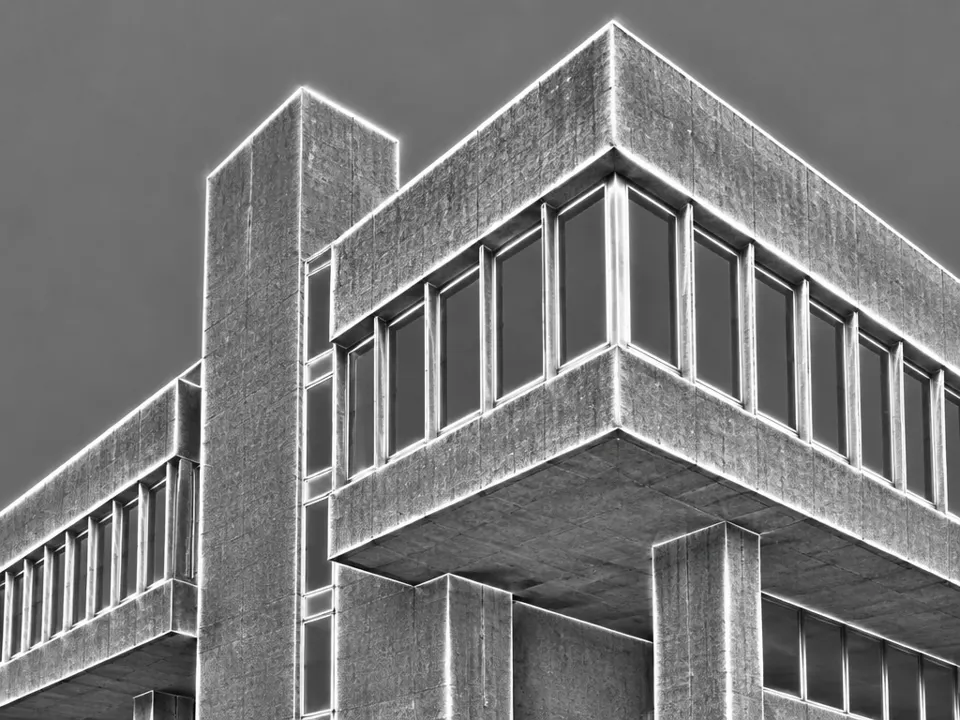
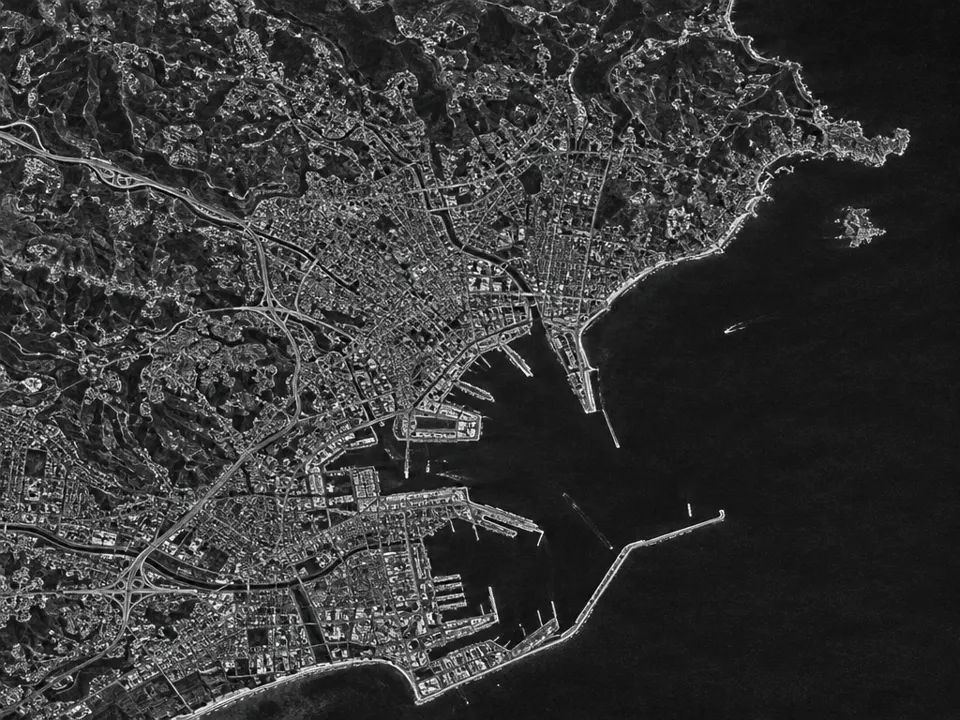
02Flowers after difference of gaussians grayscaleA grayscale image displays a flower with dark, thin outlines against a white background. It illustrates the Difference of Gaussians through high-contrast edge detection and the extraction of fine textures via spatial frequency filtering.SadaraX (talk) · CC BY-SA 3.0 · Wikimedia Commons03Models of receptive fields encoding form and color visionBiological and mathematical diagrams show a tower before and after a DoG filter. This exemplifies the effect by visualizing bandpass-like structures and how subtracting blurred versions mimics human receptive field processing.Patterson SS, Neitz M and Neitz J · CC BY 4.0 · Wikimedia Commons04Marr-waveletA 3D mesh plot displays a Marr wavelet, also known as the Mexican hat operator. This function is the mathematical equivalent of the Difference of Gaussians used for edge detection and bandpass filtering in image processing.Bhaskara · Public domain · Wikimedia Commons05Wavelet - Mex HatThe 2D plot displays a Mexican hat wavelet. This curve represents the characteristic profile of a Difference of Gaussians filter, which acts as a bandpass to highlight specific spatial frequencies.Unknown · Public domain · Wikimedia Commons06AI illustration: A grayscale building with bright edge halos is shownA grayscale building with bright edge halos is shown. These high-contrast transitions at boundaries illustrate the edge enhancement characteristic of subtracting differently blurred images.Illustration generated for the Atlas (AI)07AI illustration: A grayscale satellite map shows high-contrast outlines of urban structureA grayscale satellite map shows high-contrast outlines of urban structures and coastlines. The subtraction of two blurred versions isolates specific spatial frequencies, creating a bandpass effect that highlights topographical edges.Illustration generated for the Atlas (AI)