M 041 / 18302 Masks & Controlschematic / technique preview

Semantic Segmentation Map

segmentation, masks & control
Typeface · Lexend

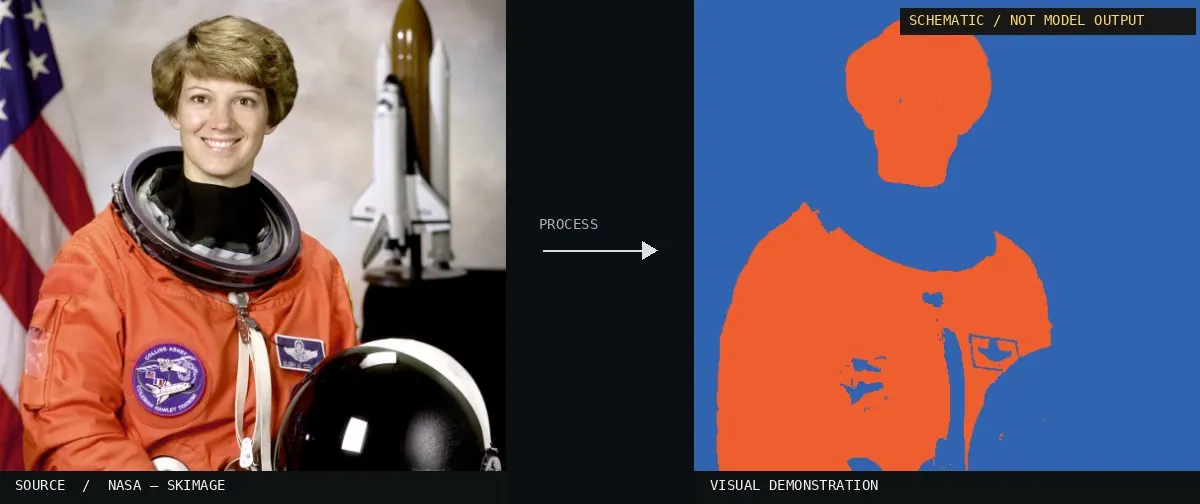
Schematic or classical approach — not a trained AI model output.
Schematic or classical approach — not a trained AI model output.Image: NASA / Eileen Collins · scikit-image (public domain)View source ↗

Prompt

Transform this image into a Semantic Segmentation Map, replacing photographic detail with flat, saturated color masks for visible categories such as people, clothing, vegetation, and background. Assign the same color to every region of the same category, with crisp silhouettes and no shading. Keep the original subject and composition.

Identify

Color areas encode categories such as person and background.

Principle

A segmentation mesh would assign an object class1 to each pixel; the preview is schematic2.

Try it out

Compare classes against instances.

Classification

Schematic visualization, not neural inference.

Further examples · 7 images

EmiMa-099-semantic-segmentation
02 EmiMa-099-semantic-segmentationA brown silhouette representing a teddy bear is distinct from green plant and blue bucket areas. These solid colors map specific categories to pixels, illustrating how semantic segmentation ignores individual object instances to prioritize class labels.MartinThoma · CC0 · Wikimedia Commons
Maskmaking for automatic detection of micronuclei
03 Maskmaking for automatic detection of micronucleiThe image displays a biological cell side-by-side with a segmented version using cyan and white masks. It demonstrates the assignment of class labels to image regions for machine-assisted recognition of cellular structures.Genomicintegrity · CC BY 4.0 · Wikimedia Commons
MicronucleimaskA
04 MicronucleimaskAA microscopic image is displayed alongside its manual segmentation map. Different colors represent distinct anatomical categories, such as the cell body and nuclei, providing a schematic visualization of class-based pixel assignment.Genomicintegrity · CC BY 4.0 · Wikimedia Commons
MicronucleimaskB
05 MicronucleimaskBThe side-by-side comparison shows an original biological sample and a corresponding semantic mask. Cyan and white areas differentiate the cell and micronuclei, illustrating how category labels are mapped to specific spatial regions.Genomicintegrity · CC BY 4.0 · Wikimedia Commons
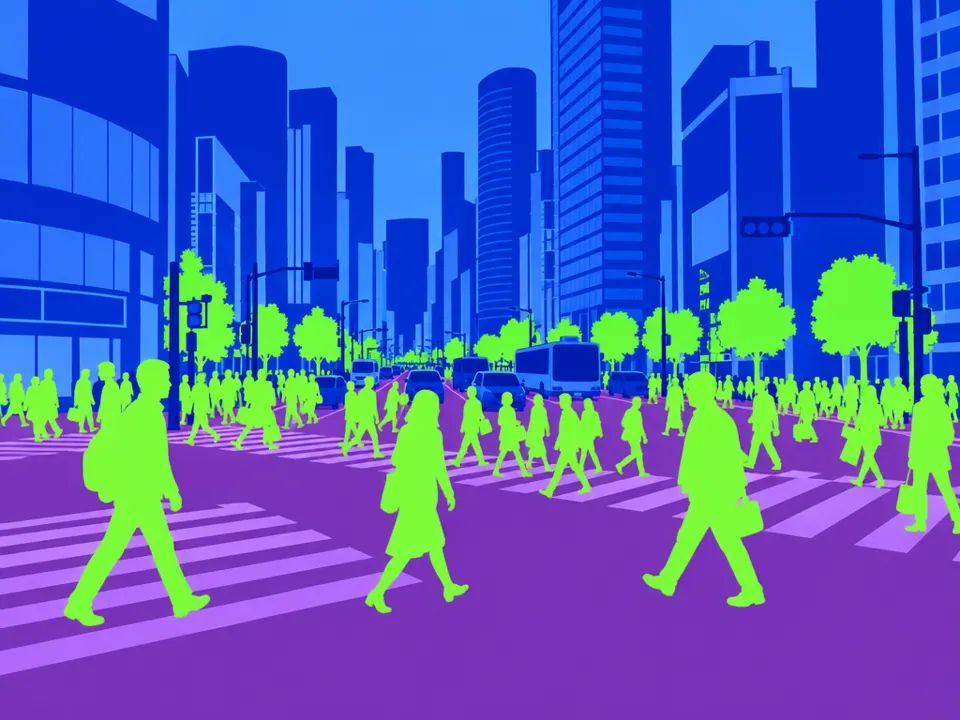
AI illustration: A cityscape uses distinct colors for pedestrians and architecture
06 AI illustration: A cityscape uses distinct colors for pedestrians and architectureA cityscape uses distinct colors for pedestrians and architecture. Uniform green silhouettes for all people illustrate semantic labeling by class rather than individual instances.Illustration generated for the Atlas (AI)
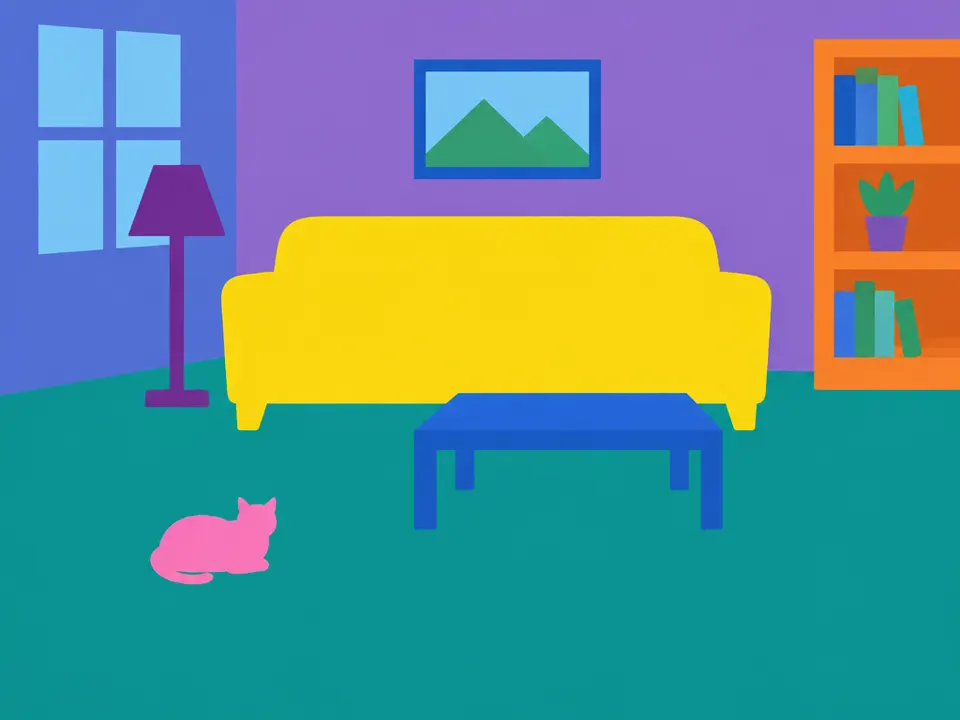
AI illustration: A living room scene consists of flat-colored shapes representing furnitur
07 AI illustration: A living room scene consists of flat-colored shapes representing furniturA living room scene consists of flat-colored shapes representing furniture and a cat. Each pixel is assigned a color based on its object category, creating a schematic semantic map.Illustration generated for the Atlas (AI)