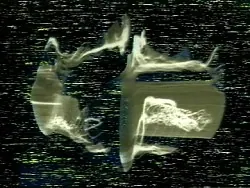
Rutt/Etra scan processing. Developed in 1973; visible in Vasulka's C-Trend in 1974.
Typeface · Electrolize
Woody Vasulka: C-Trend, 1974. Original video still, EAI.Woody Vasulka / Electronic Arts Intermix; copyright protected.View source ↗
Prompt
Apply Rutt–Etra Scan Processing, rebuilding the image as closely spaced luminous horizontal scanlines on black. Raise bright regions into curved peaks and compress shadows into low valleys, creating a rippling electronic relief with white phosphor glow, slight jitter, and sparse analog noise. Keep the original subject and composition.
The Daniel Langlois Foundation documents Steve Rutt, Bill Etra, and Louise Etra as developers. The prototype was created in 1972–73, and the commercial version followed in 1975. Steina and Woody Vasulka researched the conversion of image brightness into grid deflection; their recordings made the signal visible as material. EAI also cites George Brown's Multikeyer and Eric Siegel's Colorizer for C-Trend.
Distinction
No digitally calculated wireframe geometry: The spatial effect arises from distorted grid lines of an analog video signal. Digital practice simulates this principle.
Aftermath
Precursor to today's height-based image distortions and audio-reactive raster visuals.
Further examples · 7 images
02Rutt–Etra Scan Processing, applied to “Protests opposing Venezuelan Bolivarian Revolution in Avenida Paulista, São Paul”Protesters in São Paulo are rendered as dense, fluctuating peaks. Bright clothing and flags trigger vertical deflection in the horizontal scan lines, creating a topographic effect.Wilfredor (photo); processed for the Atlas · CC BY-SA 4.0 · Wikimedia Commons03Rutt–Etra Scan Processing, applied to “Capri - 7224”A landscape of Capri is converted into a series of jagged, linear waves. The bright reflections on the water and sky cause the scan lines to rise into sharp, spatial peaks.Jorge Royan (photo); processed for the Atlas · CC BY-SA 3.0 · Wikimedia Commons04Rutt–Etra Scan Processing, applied to “The Yellow Fellowship”The Yellow Fellowship photo becomes a complex field of oscillating lines. Bright areas within the group of people are translated into height-modulated curves across the electronic grid.Herbert Kikoy (photo); processed for the Atlas · CC BY-SA 4.0 · Wikimedia Commons05Rutt–Etra Scan Processing, applied to “Dülmen, Umland, Sonnenaufgang -- 2012 -- 8084”A sunrise in Dülmen is visualized as a dramatic vertical rise in the grid. The intense brightness of the sun creates a large, plateau-like landscape through line deflection.Dietmar Rabich (photo); processed for the Atlas · CC BY-SA 4.0 · Wikimedia Commons06Rutt–Etra Scan Processing, applied to “Ganado, Imehejek, Sudán del Sur, 2024-01-21, DD 10”Livestock in South Sudan are transformed into a sequence of rhythmic ripples. Light reflecting off the animals and ground causes the horizontal scan lines to curve upward.Diego Delso (photo); processed for the Atlas · CC BY-SA 4.0 · Wikimedia Commons07Rutt–Etra Scan Processing, applied to “Common cottongrass in a cliff crevice 2”Common cottongrass is shown as isolated, luminous peaks against a dark background. The bright white tufts of the plant dictate the vertical displacement of the scan lines.W.carter (photo); processed for the Atlas · CC0 · Wikimedia Commons
Question
How can you distinguish this image from a regular wireframe?
Show possible answer +Hide answer −
The lines originate from the television grid; image brightness distorts them. Awireframe, on the other hand, shows the edges of ageometric model.