M 092 / 18304 Print & Ditheralgorithm output

Voronoi Mosaic

dither, printing & texture
Typeface · Aboreto

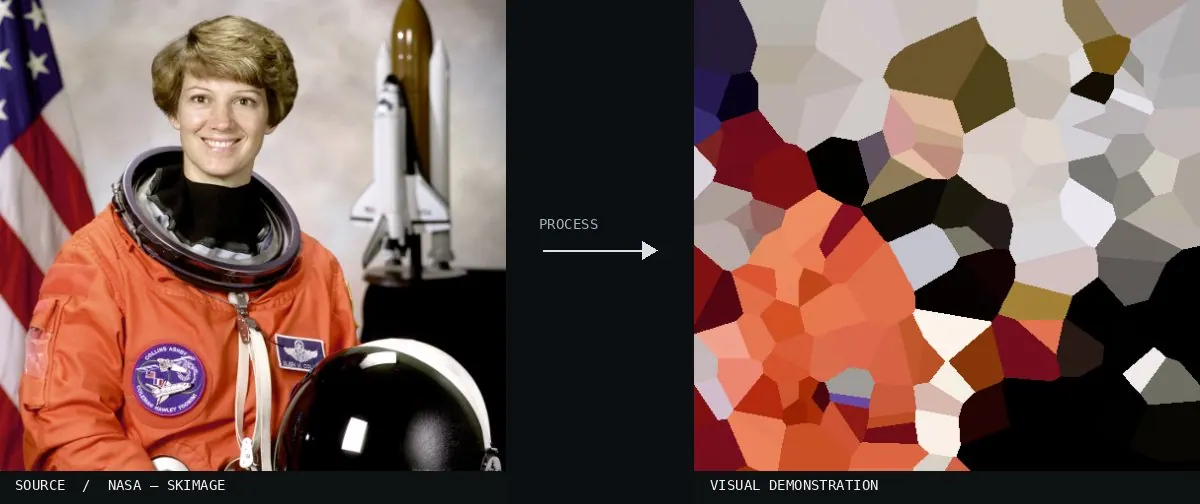
Real-world algorithm demonstration, applied to a NASA portrait.
Real-world algorithm demonstration, applied to a NASA portrait.Image: NASA / Eileen Collins · scikit-image (public domain)View source ↗

Prompt

Transform this image into a Voronoi Mosaic of irregular, tightly adjoining polygonal cells. Fill each cell with one representative local image color, using uneven cell sizes and crisp straight boundaries. Replace fine texture with flat facets, avoiding grout, bevels, and artificial lighting. Keep the original subject and composition.

Identify

Polygonal1 color areas replace image details.

Principle

Each pixel is assigned to the nearest random cell center2.

Try it out

Change the cell number.

Classification

Calculated image processing result.

Further examples · 7 images

Voronoi colors
02 Voronoi colorsA dense grid of multicolored polygons fills the frame. It demonstrates the Voronoi Mosaic effect through a high frequency of cells where each pixel adopts the color of its nearest randomly placed seed point.Bayu198 · CC0 · Wikimedia Commons
Voronoi AAAAA14
03 Voronoi AAAAA14Large, vibrant polygonal shapes are centered around visible white dots. This is a clear example of the mosaic effect, showing how different cell numbers influence the size and scale of the resulting color areas.SmallJarsWithGreenLabels · CC0 · Wikimedia Commons
Voronoi static chebychev
04 Voronoi static chebychevA collection of angled color blocks is shown, with black squares marking the cell centers. The image illustrates a specific Chebychev distance calculation, creating distinct geometric boundaries typical of this digital processing method.Jahobr · CC0 · Wikimedia Commons
Voronoi Diagram
05 Voronoi DiagramA variety of muted and dark polygonal cells cover the image plane. It serves as a classic diagram where the image detail is entirely replaced by flat-colored regions determined by spatial proximity to seeds.Fleegle2000 · CC BY-SA 4.0 · Wikimedia Commons
Voronoi Diagram, Capitals of Every Country
06 Voronoi Diagram, Capitals of Every CountryA world map processed into polygonal cells based on city coordinates. It shows how the effect replaces continuous geographical data with discrete color areas.Vardan Semerjyan · CC BY-SA 3.0 · Wikimedia Commons
Voronoi Diagram of Prime Spiral
07 Voronoi Diagram of Prime SpiralA high-density Voronoi diagram with a spectral color gradient. The small, irregular polygons effectively replace the original detail with a calculated mosaic pattern.Vardan Semerjyan · CC BY-SA 3.0 · Wikimedia Commons