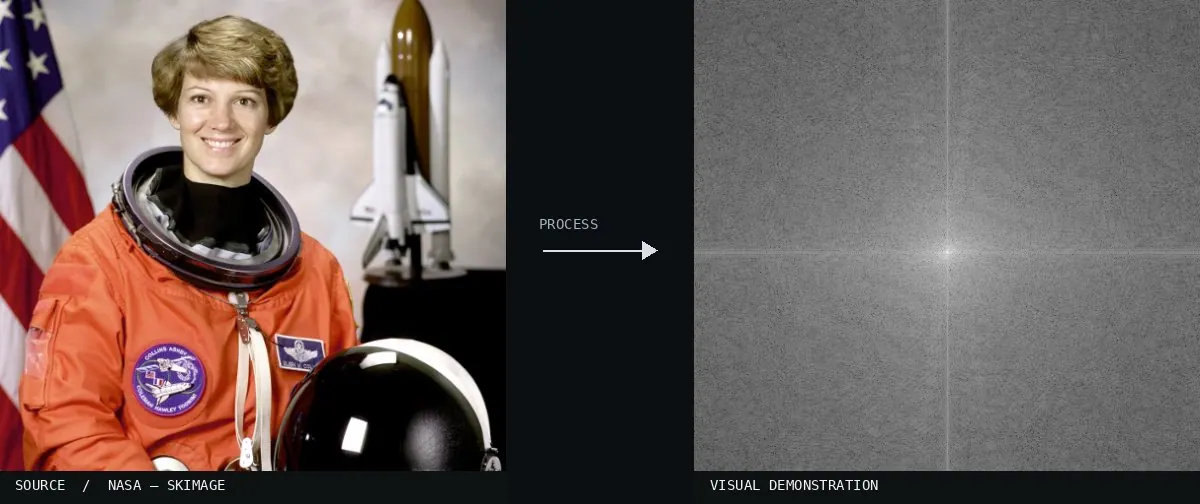
Real-world algorithm demonstration, applied to a NASA portrait.Image: NASA / Eileen Collins · scikit-image (public domain)View source ↗
Prompt
Apply Fourier Magnitude Spectrum as a dominant translucent visualization over the photograph: a brilliant central point, symmetric starburst streaks, and scattered grayscale frequency speckles against a dark field. Compress brightness to reveal faint surrounding structures, retaining the scene subtly beneath the pattern. Preserve the original subject and composition.
02Dandelion clock dft dctA dandelion clock image is shown alongside its Discrete Fourier Transform (DFT) heat map. The central red glow in the DFT represents the concentrated low-frequency spatial components of the original image.Alessio Damato · CC BY-SA 3.0 · Wikimedia Commons03Fourier Slice TheoremThe diagram displays a medical cross-section, its 1D projections, and a 2D Fourier spectrum. It demonstrates the relationship between spatial lines in the spectrum and periodic patterns within the source image.Andreas Maier · CC BY 4.0 · Wikimedia Commons04Chest radiograph 2D Fourier SpectrumA chest radiograph is shown alongside its 2D Fourier spectrum. The spectrum displays a central brightness representing low frequencies and a cross-pattern corresponding to the vertical and horizontal spatial structures in the anatomical image.Generated by Kieran Maher using NIH Image. · Public domain · Wikimedia Commons05NM13 8The panel shows a diagonal grating and its corresponding Fourier magnitude spectrum as a pair of dots. It demonstrates how a single spatial frequency in an image translates to specific coordinates in frequency space.KieranMaher at English Wikibooks · Public domain · Wikimedia Commons06TiMnImage2yA micrograph of a quasicrystal is shown with its Fourier transform inset. The star-like, ten-fold symmetrical diffraction pattern in the spectrum reveals the complex periodicities and spatial orientations present in the physical structure.P. Fraundorf · CC BY-SA 3.0 · Wikimedia Commons07FFT.filtered.Siemens.starThe image shows the 2D Fourier magnitude spectrum of a Siemens star test pattern. The radial lines in the spectrum correspond directly to the angular spatial frequencies of the spokes in the input scene.Bautsch · CC0 · Wikimedia Commons